Add a polygon
Polygon vector graphics are one of the important map elements of map overlays and can be used to highlight the shape of a region. There are various types of vector graphic overlays, and you can choose the appropriate type according to your needs. This article describes how to add an interactive polygon AMap.Polygon to the map surface.
Example of polygon drawing
1、Add vector polygon
1.1 Create a map
const map = new AMap.Map("container", {
  center: [77.193045, 28.59086],
  showOversea: true, //Enable world Map
  zoom: 8.8,
});1.2 Create Polygon object
The AMap.Polygon object provides users with the ability to draw polygons on the map surface. Properties such as fillColor, strokeColor, and outline style can be set for the polygon.
const pathArr = [
  [
    [
      [76.989798, 28.659269],
      [76.969885, 28.603219],
      [77.081808, 28.548949],
      [77.193732, 28.615275],
      [77.137427, 28.694209],
    ],
  ],
];
const polygon = new AMap.Polygon({
  path: pathArr,
  fillColor: "#ccebc5",
  strokeOpacity: 1,
  fillOpacity: 0.5,
  strokeColor: "#2b8cbe",
  strokeWeight: 1,
  strokeStyle: "dashed",
  strokeDasharray: [5, 5],
});path is the node coordinate array of the polygon contour. The polygon supports the drawing of ordinary polygons, polygons with a single hole, and polygons with multiple holes.
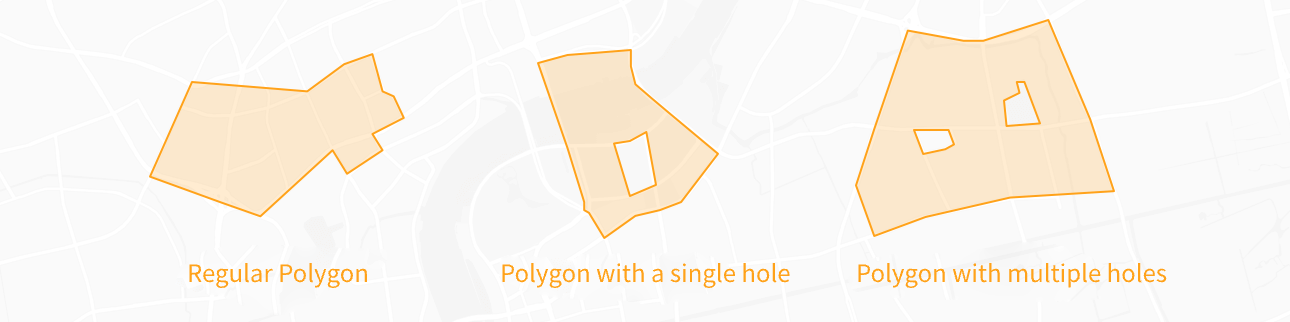
Illustration of the contour coordinate array for various types of polygons: (assuming lnglat = new AMap.LngLat(lng, lat) or lnglat = [lng, lat])
Regular polygon:path = [lnglat, lnglat ...] or path = [[lnglat, lnglat ...]]
Polygon with a single hole:path = [[lnglat, lnglat ...], [ lnglat, lnglat ...]]
Polygon with multiple holes:path = [[lnglat, lnglat ...], [lnglat, lnglat ... ], [lnglat, lnglat ...] ...] 1.3 Add events to Polygon
Add mouseover and mouseout events to the Polygon instance in the example.
//Change style on mouse hover
polygon.on("mouseover", () => {
  polygon.setOptions({
    fillOpacity: 0.7, //Polygon Fill Transparency
    fillColor: "#7bccc4",
  });
});
//Restore style on mouse out
polygon.on("mouseout", () => {
  polygon.setOptions({
    fillOpacity: 0.5,
    fillColor: "#ccebc5",
  });
});1.4 Add Polygon instance to the map
map.add(polygon)