Polygon drawing and Editing
AMap.Polygon can draw polygons, which are fillable shapes composed of multiple points, and can be any shape, such as rectangles, triangles, etc., used to mark specific areas. This article describes how to draw and edit polygons on the map, and set properties such as fill color and outline width.
Polygon drawing example
AMap.Polygon provides properties to set fill color, stroke color, outline style, fill opacity, etc.
1、Draw polygon
1.1 Create Map
var map = new AMap.Map("container", {
  center: [100.491422, 13.749313],
  showOversea: true, //Enable world Map
  mapStyle: "amap://styles/whitesmoke",
  viewMode: "2D",
  zoom: 8.8,
});1.2 Set the node coordinate array of the polygon contour
//Node coordinate array of the polygon contour
var path = [
  new AMap.LngLat(99.907748, 14.210075),
  new AMap.LngLat(99.945608, 13.444189),
  new AMap.LngLat(101.441075, 13.612899),
  new AMap.LngLat(101.327495, 14.323209),
];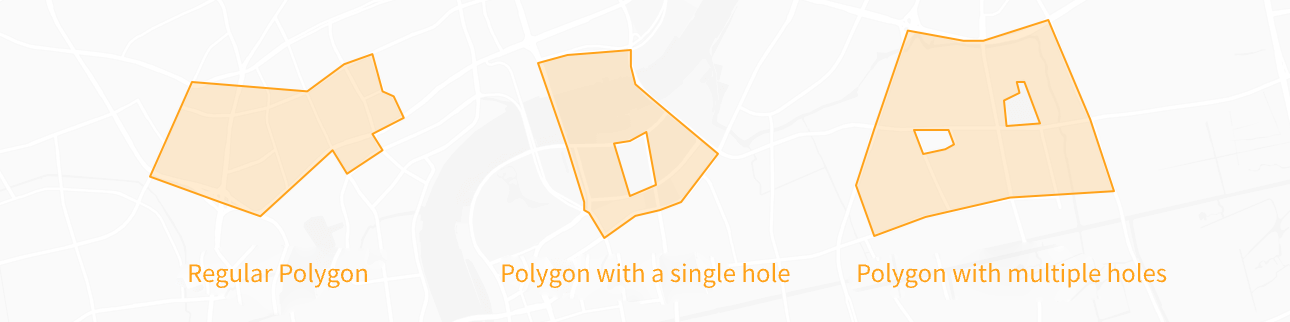
Polygons support drawing of ordinary polygons, polygons with a single hole, and polygons with multiple holes.
Illustration of the contour coordinate array for various types of polygons: (assuming lnglat = new AMap.LngLat(lng, lat) or lnglat = [lng, lat])
Regular polygon:path = [lnglat, lnglat ...] or path = [[lnglat, lnglat ...]]
Polygon with a single hole:path = [[lnglat, lnglat ...], [ lnglat, lnglat ...]]
Polygon with multiple holes:path = [[lnglat, lnglat ...], [lnglat, lnglat ... ], [lnglat, lnglat ...] ...]
1.3 Create a Polygon instance
var polygon = new AMap.Polygon({
  path: path,
  fillColor: "#fff",
  strokeWeight: 2,
  strokeColor: "red",
});1.4 Polygon object added to Map
map.add(polygon);
//Adjust the overlay to the appropriate field of view
map.setFitView([polygon])Use the map.add() method to add polygon instances to the map. The map.setFitView() method will automatically zoom the map to the appropriate view level based on the distribution of the overlays added to the map.
1.5 Adding events to Polygon
polygon.on("mouseover", () => {
  polygon.setOptions({
    //Method for modifying polygon attributes
    fillOpacity: 0.7,
    fillColor: "#7bccc4",
  });
});

polygon.on("mouseout", () => {
  polygon.setOptions({
    fillOpacity: 1,
    fillColor: "#fff",
  });
});
2、Polygon editing
AMap.PolygonEditor polygon editing plugin supports modifying existing polygons or dynamically drawing polygons on the map. By adjusting the position, size, and shape of polygons, real-time editing and drawing can be achieved.
2.1 Construct the polygon editor object and enable the editing state of the polygon
//Import the polygon editor plugin
map.plugin(["AMap.PolygonEditor"], function () {
  //Instantiate the polygon editor, passing in the map instance and the polygon instance to be edited.
  var polygonEditor = new AMap.PolygonEditor(map, polygon);
  //Enable edit mode
  polygonEditor.open();
});polygonEditor.open() is the method to start editing an object. If you want to end the editing, you can call the polygonEditor.close() method.