Add a map
This guide provides detailed instructions on how to create a map and incorporate various overlays, including points, lines, and polygons. Additionally, the map supports comprehensive road data and Points of Interest (POI) display for international locations.
The map is a key feature within our comprehensive suite of advanced mapping tools. Should you require access to premium features or additional support, please initiate a support ticket to request a business consultation.
Application example
1、Map display
1.1 HTML Page preparation
Write the basic structure code of the HTML page, a <div> node is needed as the map container, and specify the id attribute for this <div>, in this tutorial we use <div id=\"container\"></div>, the id can be customized by you.
<!DOCTYPE html>
<html>
  <head>
    <meta charset="utf-8" />
    <meta http-equiv="X-UA-Compatible" content="IE=edge" />
    <meta
      name="viewport"
      content="initial-scale=1.0, user-scalable=no, width=device-width"
    />
    <title>HELLO, AMAP!</title>
    <style>
      html,
      body,
      #container {
        width: 100%;
        height: 100%;
      }
    </style>
  </head>
  <body>
    <div id="container"></div>
  </body>
</html>If it is mobile development, please add a <meta> tag in the <head> tag and set the name attribute to "viewport" to achieve the best drawing performance.
<meta name="viewport" content="initial-scale=1.0, user-scalable=no" />Specify the height and width of the map container through css.
#container {
  width: 300px;
  height: 180px;
} 1.2 Load JS API
To avoid issues related to the key during development, please ensure the correct use of the key and security key.
<script type="text/javascript">
    window._AMapSecurityConfig = {
        securityJsCode: "「The security key you applied for」",
    };
    window._AMapServiceConfig = {
        type: 'oversea', // Deployment Environment Setup
    };
</script>
<script src="https://sg-webapi.opnavi.com/maps?v=2.0&key=「The application key you applied for」"></script>
<script>
    const map = new AMap.Map("container", {
        viewMode: "3D", //Default to 2D mode
        zoom: 11, //Zoom level
        showOversea: true, //Enable world Map
        center: [77.193045, 28.59086], //Center point
    });
</script>1.3 Map Initialization
Ensure that your API key has been authorized for map permissions. To display the map, initialize it by setting the showOversea parameter to true.
const map = new AMap.Map("container", {
  viewMode: "3D", //Default to 2D mode
  zoom: 11, //Zoom level
  showOversea: true, //Enable world Map
  center: [77.193045, 28.59086], //Center point
});The map displays detailed road data and Points of Interest (POI) for over 200 overseas countries and regions. To verify successful integration, ensure that when the map's center point is set to an overseas location and the zoom level is 10 or higher, the map renders visible content rather than appearing blank.
1.4 Theme Style
If you want to change the map style, you just need to pass in mapStyle when creating the map object in the previous step to set the map style. You can use the official map style or create a custom style using the GeoHUB custom map platform.
Official theme style
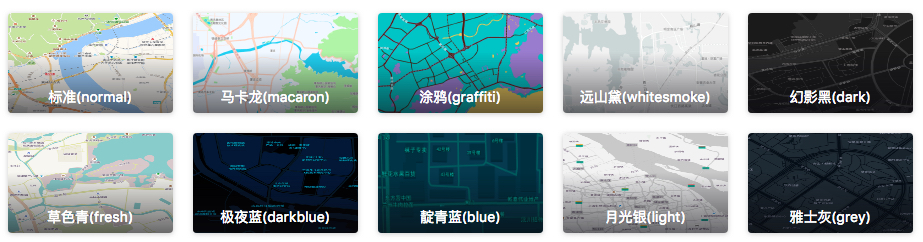
map = new AMap.Map("container", {
  mapStyle: "amap://styles/whitesmoke", //Set map display style
});
You can also use map.setMapStyle('amap://styles/whitesmoke') to dynamically set the map style.
So far, you have successfully displayed a simple map using JS API . You can further explore and use other features according to your needs, such as Add layer, Add point marker, etc.