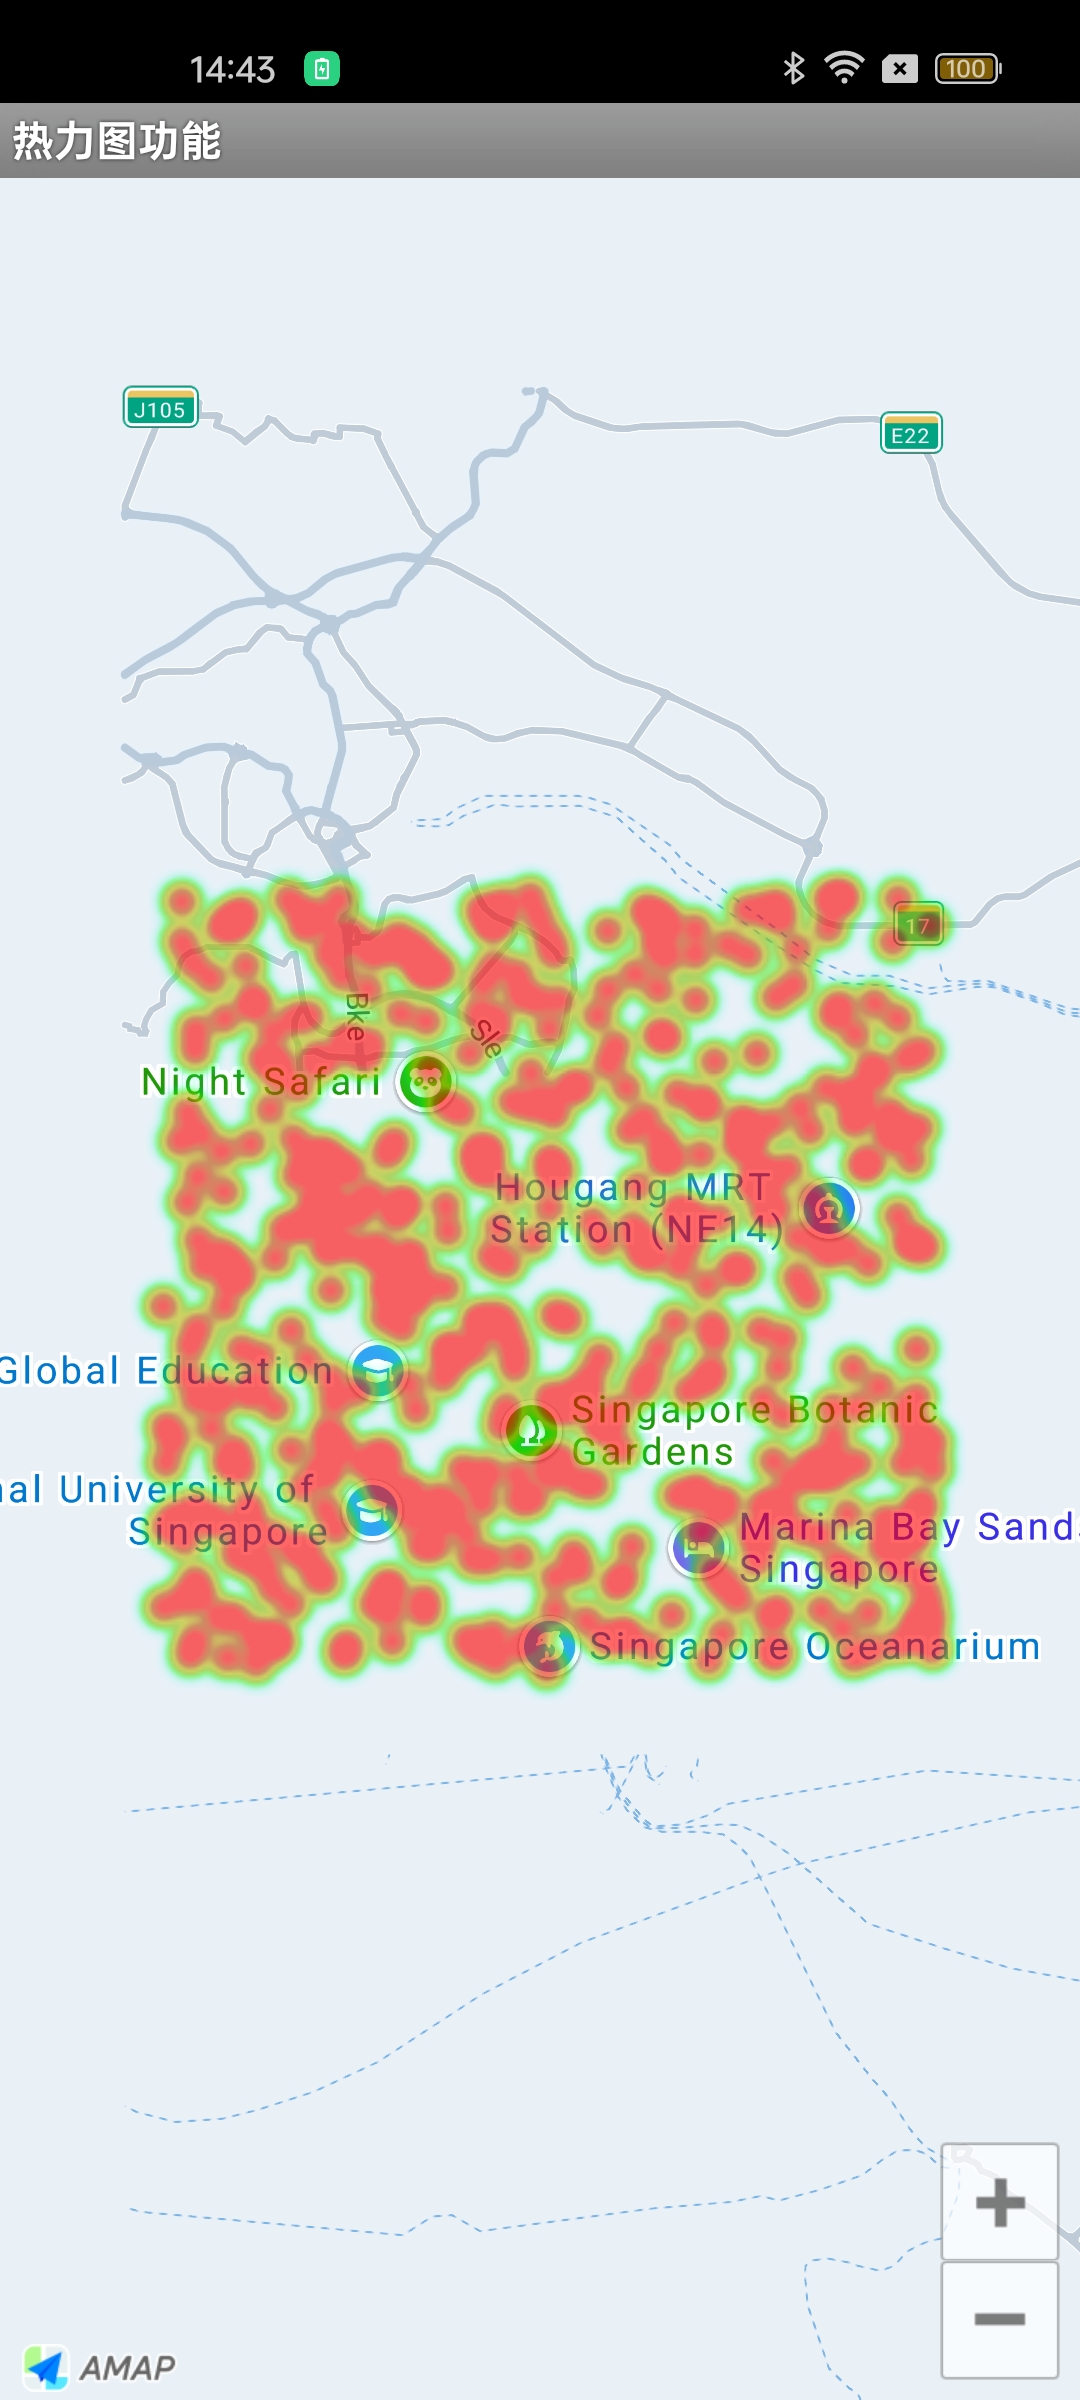
Heatmaps
The heatmap feature enables you to visualize business data on a map, providing an intuitive representation of the intensity or concentration of entities—such as people or vehicles—within a given area.
Step 1: Prepare Heatmap Data
The following example uses local mock data to demonstrate that the SDK requires an array or list of latitude/longitude coordinates for the heatmap.
Sample code:
// Generate a list of heatmap point coordinates
LatLng[] latlngs = new LatLng[500];
double x = 1.2834;
double y = 103.8607;

for (int i = 0; i < 500; i++) {
double x_ = 0;
double y_ = 0;
x_ = Math.random() * 0.2 - 0.1;
y_ = Math.random() * 0.2 - 0.1;
latlngs[i] = new LatLng(x + x_, y + y_);
}
Step 2: Build a HeatmapTileProvider
HeatmapTileProvider is the core class for generating heatmaps. The following code shows basic usage:
// Build the HeatmapTileProvider
HeatmapTileProvider.Builder builder = new HeatmapTileProvider.Builder();
builder.data(Arrays.asList(latlngs))          // Set the data for the heatmap
       .gradient(ALT_HEATMAP_GRADIENT);        // Set the heatmap gradient (optional; DEFAULT_GRADIENT is used by default)
// For details on configuring Gradient, see the reference manual.

// Construct the HeatmapTileProvider object
HeatmapTileProvider heatmapTileProvider = builder.build();
Step 3: Add the Heatmap Layer
Use TileOverlay to render the heatmap on the map:
// Initialize TileOverlayOptions
TileOverlayOptions tileOverlayOptions = new TileOverlayOptions();
tileOverlayOptions.tileProvider(heatmapTileProvider); // Set the tile provider

// Add the TileOverlayOptions object to the map
mAMap.addTileOverlay(tileOverlayOptions);
The result is shown in the following image: